
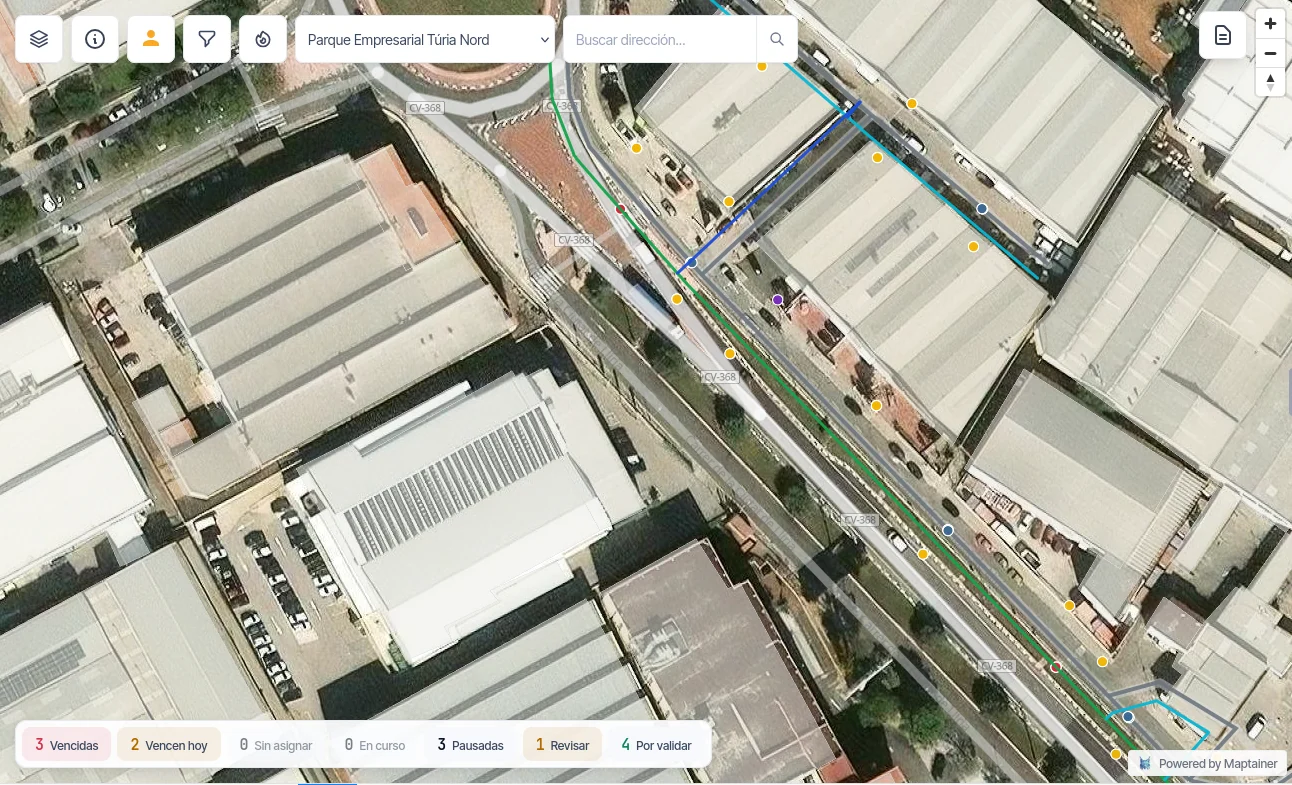
The network maps in one place, maintenance in another and the readings in a spreadsheet.
Every reading campaign is put together by hand. A meter has been stuck for months and nobody notices until someone checks the series. And when there is a leak, knowing which service connections hang off that section depends on whoever knows the network by heart. Maptainer brings the network, its meters and its campaigns into one system, on the real geometry.
It is for you if
- You are a private water or metering network operator With the network, the meters and the readings currently spread across tools that do not talk to each other.
- Your readings are taken in the field By routes and campaigns, with readers working in places where coverage comes and goes.
- You already have your network mapped In GeoPackage, Shapefile, GeoJSON, DXF or CSV. It loads as it is, with no redrawing.
It is not for you if
- You are looking for a water billing system Billing is not implemented and is not part of the product. Maptainer delivers the measured data to your billing system through the public API.
- Your readings come in by remote reading There is no connection to remote reading devices or sensors. Readings come in from the field through the app, or through the API with the write scope.
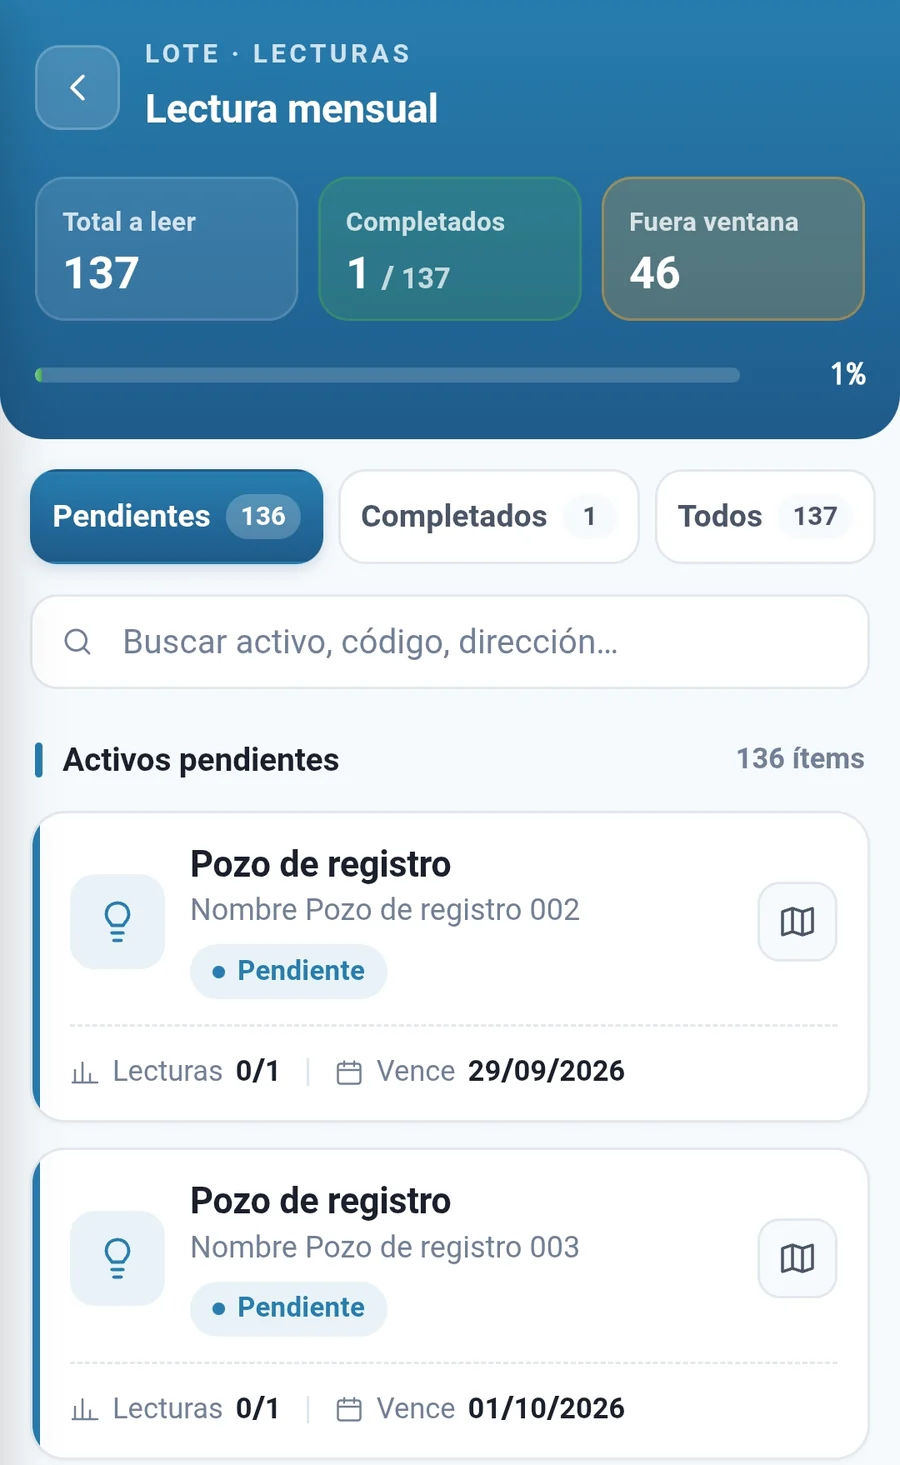
Campaigns schedule themselves and are read without coverage.
- Automatic campaign batches Scheduled from each point's frequency and shared out across the team. Nobody builds them by hand every period.
- Static routes The fixed round by which an area has always been read, kept as a template.
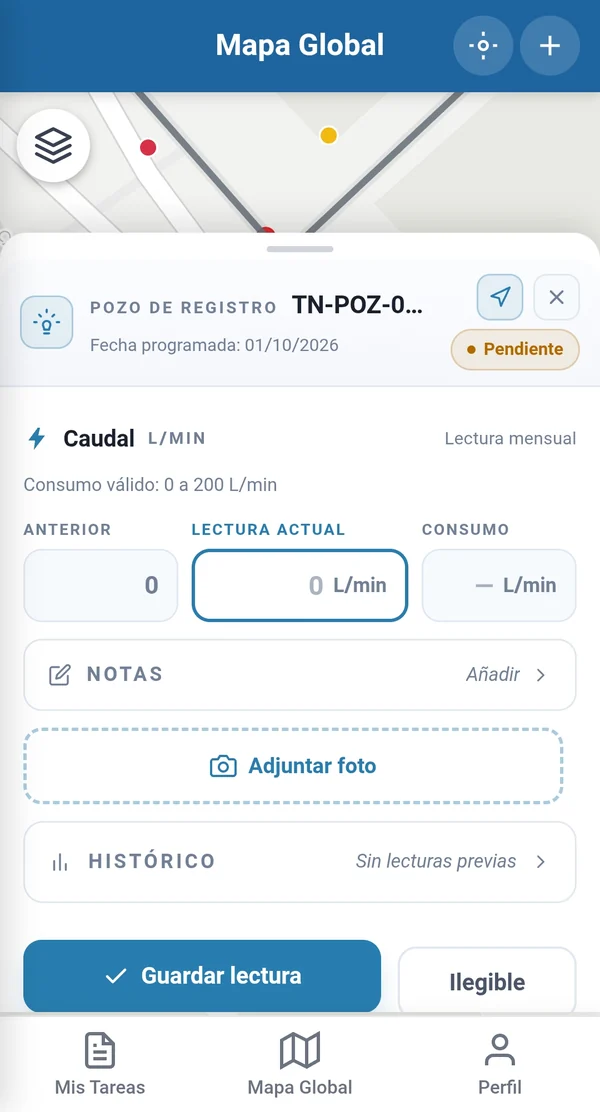
- Per-batch offline work Each batch travels in its own SQLite database, thresholds included, so the reading is validated at the chamber itself.
- Measuring points With their validity thresholds and reading frequency.
- Geolocated photograph Mandatory where the asset type requires it. If the customer disputes a reading, the photo is there.
A stuck meter shows up at the next reading, not in the complaint.
Each reading is compared with that point's previous pattern to flag the one that falls outside it. And the validity thresholds do not stay at the value set on day one: they can be recalculated from the real behaviour recorded.
It picks up abnormal consumption, stuck meters and reading errors. It describes what has happened; it does not predict what will happen. The statistical detail of how it is calculated is in the public functional documentation.
Where a meter needs replacing and where there is a loss to track down.
Every measuring point keeps its full series, with its trend and its anomalies flagged. That is the basis for deciding on data, not on the memory of your most experienced reader.
Every element with its geometry, not loose points on a map.
Sections are lines, valves and hydrants are points, sectors are polygons. Asset types define the expected geometry of each element and the composition hierarchy records what contains what.
The spatial queries run on that real geometry in PostGIS: what lies within two hundred metres of the leak, which elements fall inside a polygon drawn on the map, which assets sit in each crew's sector. The answer no longer depends on who is on call.
Maptainer does not bill. It delivers the measured data.
It is the first question people ask, so it comes early: billing is not implemented and is not part of the product.
Measuring points and their readings are exposed through the public REST API, with incremental sync and scopes, plus a write scope for readings when they come in from another system. That is how data flows to and from your billing system.
Frequently asked questions
Does it integrate with remote meter reading?
Can I load the network maps I already have?
Last updated:
A demonstration on a network like yours.
Tell us what your network looks like, how many meters you read and how you organise your campaigns today. With that, we prepare the session on a water network demonstration environment similar to yours.