
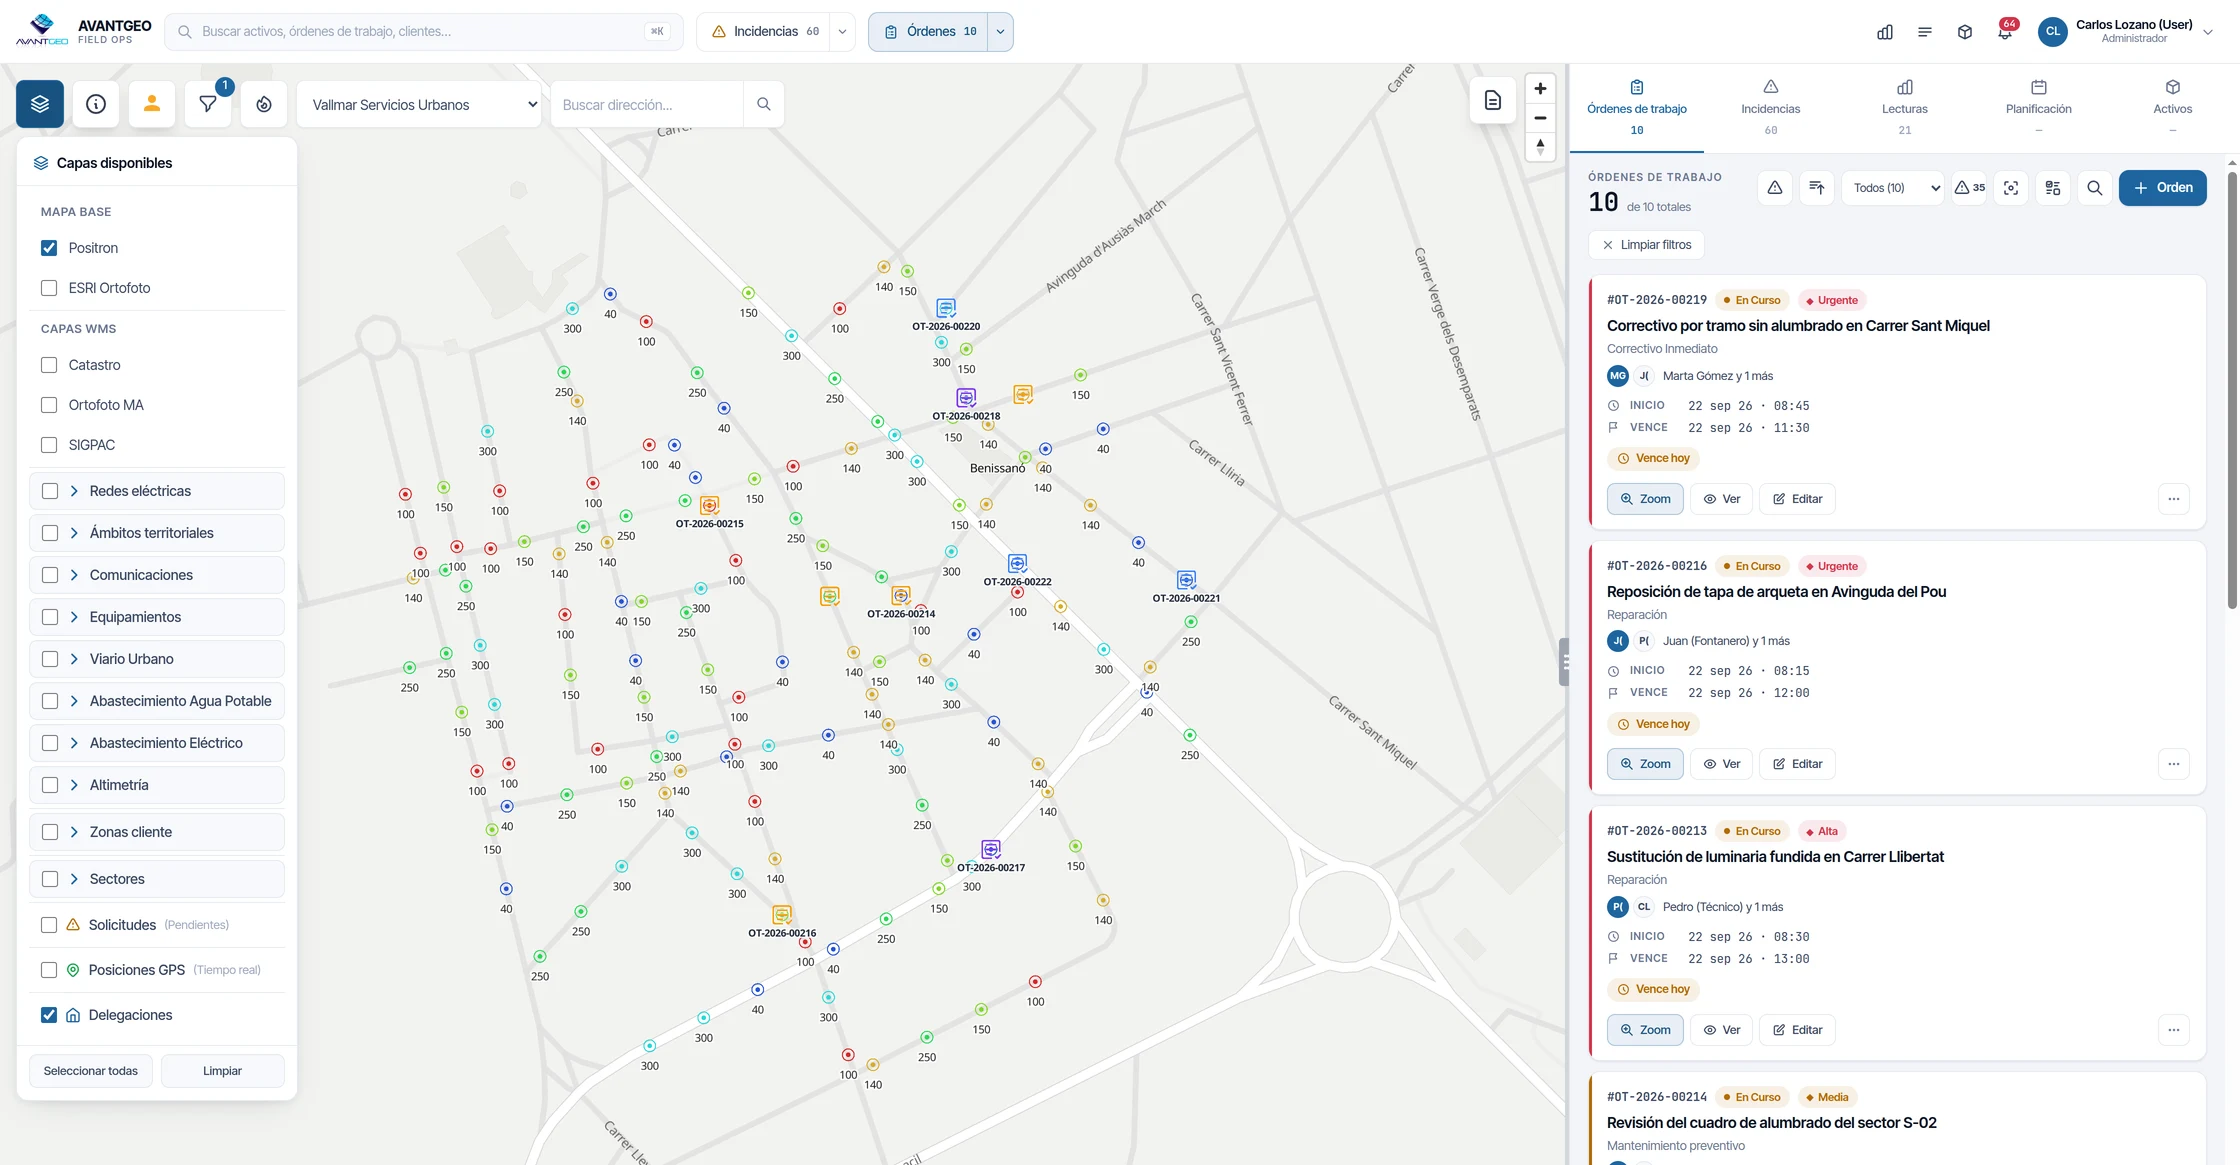
If the map, the work orders and the costs live in different systems, no figure ever adds up.
The inventory in a Shapefile. The work order in the CMMS. The kilometres on the expense sheet. The indicator in a spreadsheet someone rebuilds every month. Every step between them is a manual copy, and every copy is an error nobody sees until month-end. In Maptainer they are eight areas on a single data model: the asset drawn on the map is the same one assigned to the work order, the one that consumes materials and the one that feeds the indicator.
Find your problem. The area that solves it is right below.
You do not need to read all eight. Start with the one that costs you the most hours this week.
- Someone goes up on a roof with an expired certificate The eligibility engine cross-checks skills at a minimum level, certifications valid on the date of the job, shift, public holidays, absences and road distance, and tells you why someone is not eligible. Planning and skills.
- The job sheet comes back on paper because there was no signal Pre-generated packages with the working data, the inventory tiles and the PNOA orthophoto (Spain’s national aerial imagery). A full working day in flight mode and a single upload on the way back. Offline field app.
- Nobody knows for sure which assets there are or where they are Real geometry in PostGIS, a composition hierarchy and import from GeoPackage, Shapefile, GeoJSON, DXF and CSV. Assets and GIS.
- Nobody knows what a job really cost The work order closes with materials at the actual cost of the stock movement, hours at each person’s cost and kilometres at the day’s fuel price. Work orders.
- Travel eats the margin and never shows up in any report Every kilometre charged to its work order, with the official fuel price downloaded every 30 minutes from the API of Spain’s Ministry for the Ecological Transition. Fleet and true cost.
- Half the morning answering emails from customers asking how their job is going Each customer sees their assets on the map, their work orders, their incidents and their SLA, with their own identity and roles. Customer portal.
- The MTTR you report to management depends on who calculated it MTBF, MTTR by criticality against the SLA target, availability, backlog in weeks and wrench time, calculated on the work actually done. Maintenance analytics.
- Readings arrive in a spreadsheet three days later Measuring points with thresholds and frequency, campaign batches with offline work and statistical anomaly detection. Meter readings.
If you would rather read it in order.
If you are coming from a plant CMMS, start with planning: that is where the difference shows most. If you are coming from a GIS, start with work orders: that is the layer you are missing.
Last updated:
What it does, in writing. How it fits your operation, in half an hour.
The complete functional documentation is published and the API reference can be consulted without a key. To see how it fits your case, request an evaluation session: we ask you about your operation beforehand and prepare it on a similar case.