
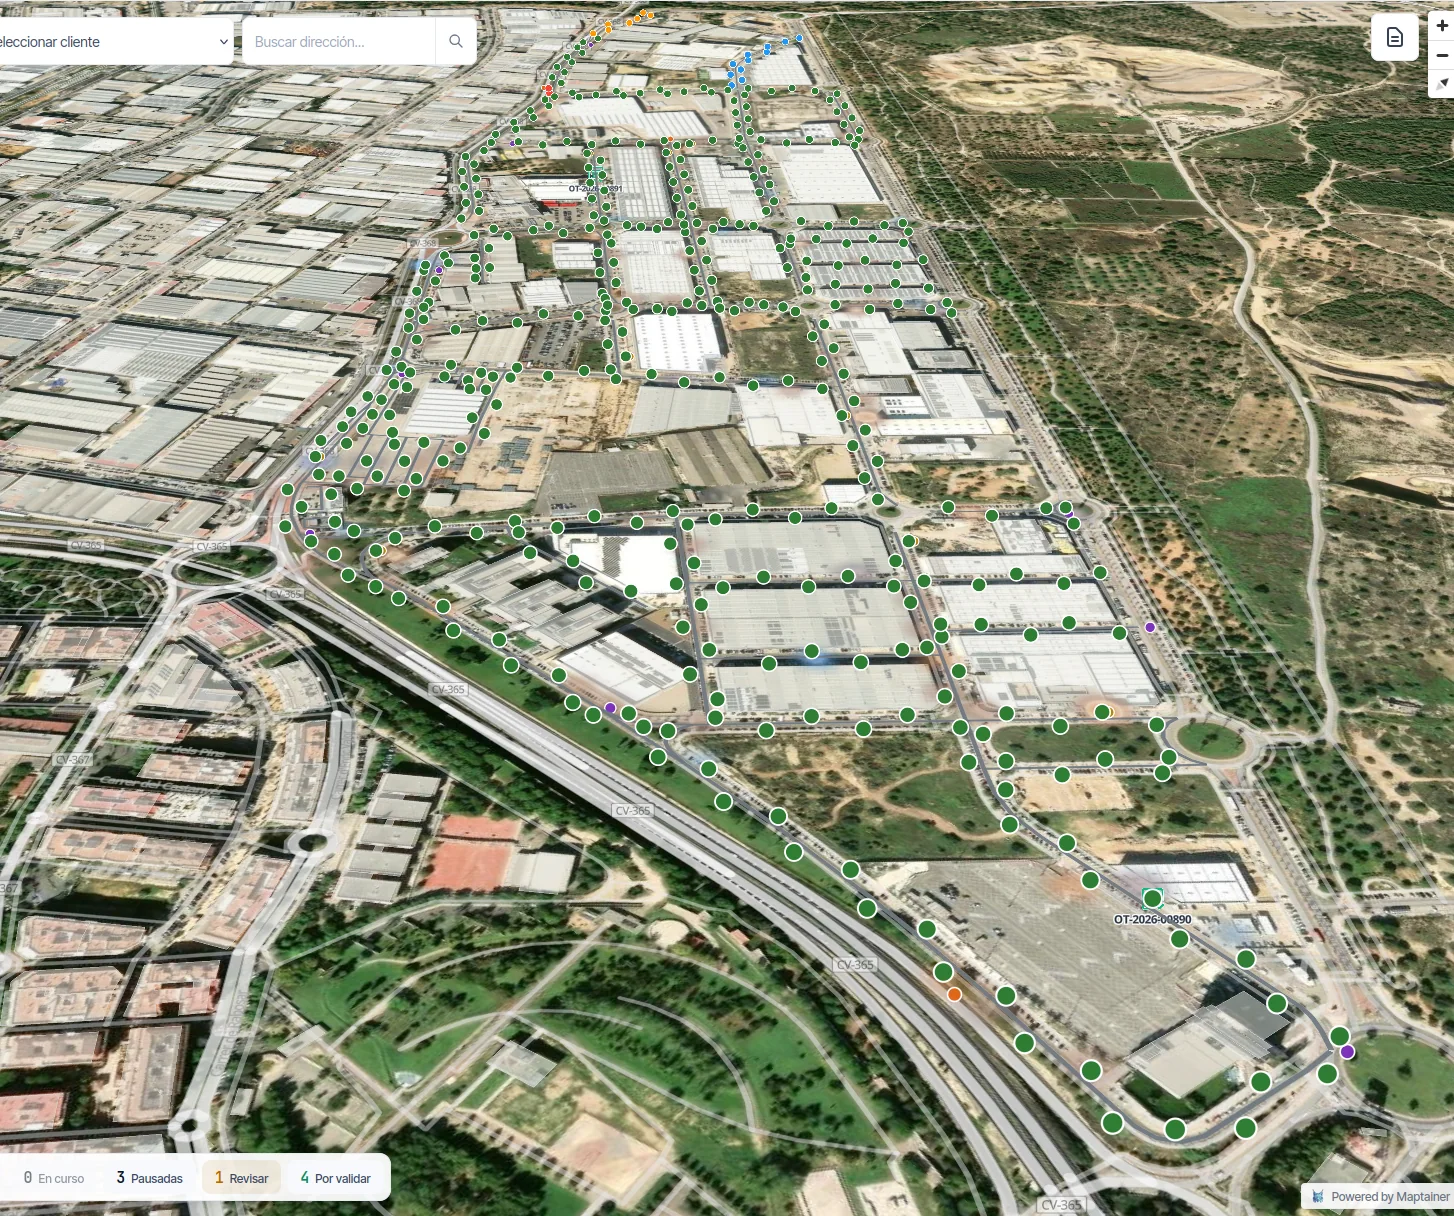
Management wants the availability of every plant. You have one spreadsheet per branch.
Each site runs its maintenance its own way. Material leaves the central warehouse, travels for weeks in the van and turns up consumed on the wrong work order. One plant meets its preventive maintenance plan and the one next door postpones it, and nobody at head office notices. And you cannot compare the OPEX of one plant with another, because they are not measured the same way. Maptainer manages the whole portfolio as a single operation, with indicators calculated on what was actually done.
It is for you if
- You operate a portfolio of dispersed sites Solar PV, wind, logistics hubs, industrial parks, campuses or large sites: assets far apart from each other that have to be kept available.
- Your technicians spend the day on the road And in places with no coverage: underground plants, remote parks, rooftops.
- You carry out regulated work At height, on low or medium voltage, or in confined spaces, where assigning the wrong person is not an inefficiency but a liability.
- You have to defend OPEX to management With cost per asset and per site, measured the same way across the whole portfolio.
It is not for you if
- What you are after is real-time monitoring Maptainer manages asset maintenance, not asset monitoring. It does not connect to plant monitoring systems.
- You manage a single, compact site Much of the value lies in consolidating the portfolio and comparing plants with each other. With a single site where travel does not matter, a general-purpose CMMS will serve you better and will probably cost you less.
The indicators you are asked for, calculated on the work actually done.
Not on what each branch declares at month end, but on the real history of work orders and statuses.
- Availability, split By breakdown and by maintenance. Adding them together hides exactly what you need to decide on.
- MTTR by criticality Compared against the SLA target for that criticality level.
- MTBF by asset type Mean time between failures, on the real history of corrective maintenance.
- Planned versus unplanned If the ratio does not improve, the preventive maintenance plan is not working.
- Backlog in weeks In weeks of work, not in number of work orders.
- Wrench time Rebuilt from the intervals in the status history.
Cost per asset and per site, comparable across plants.
Each work order builds up materials at the true cost of the movement, hours at the cost of the person and kilometres priced at that day's fuel price. Rolled up by site, you can compare what it costs to keep one plant running against another on a like-for-like basis.
The warehouse per branch and the mobile warehouse on the vehicle put an end to the usual distortion of material that travels for weeks in the van and ends up charged to the wrong place.
When health and safety asks who was qualified for that job, the answer is already in the system.
The eligibility engine cross-checks skills with a minimum level and certifications valid on the date of the work, and when someone is not eligible it gives the reason. Expiry tracking warns you before a certificate runs out.
Underground plant, remote park, rooftop. The day gets done all the same.
The technician sets off with the day's work downloaded (work base, asset tiles and PNOA orthophoto, Spain's national aerial imagery) and completes it offline, signature and photographic evidence included.
And the preventive maintenance plan does not send them to a plant to do a task without the material: work orders are generated automatically by asset type or for a specific asset, and before generating them the system checks stock for what the task consumes and warns you if there is not enough.
The portfolio organised the way your company is, not as a flat list.
Branches reflect your territorial organisation, with their own staff, warehouses and holiday calendar. Sectors and zonings are the operational division you use to distribute work.
Underneath sits the inventory's composition hierarchy: a transformer substation contains switchgear cells, a plant contains inverters and trackers. With maximum quantity and mandatory flags, so you know when a set is incomplete.
Your corporate dashboard is fed by the API, not by an email with a spreadsheet attached.
Assets, asset types, measuring points and readings are exposed through incremental sync, per entity and from a given date, with pagination and scopes: the way to feed the dashboard without downloading the whole portfolio every night.
And when you need the complete set (an audit, a change of supplier, a consolidation) there is a full export endpoint that delivers incidents, work orders, assets and photographs. The API reference is open, with no key required.
Frequently asked questions
Can I consolidate a portfolio with sites in several regions?
Does it connect to plant monitoring systems?
Last updated:
A demo built around your type of site.
Tell us what you operate, how many sites you have and how many technicians you have in the field. With that, we prepare the session on a demo environment similar to your portfolio.