
Introduction
The builder does not calculate new figures. Each block takes its data from what Maptainer already calculates: the Dashboard, costs, the fleet and measurements. An indicator is therefore the same in your dashboard, in the standard dashboard and in the PDF.
| Concept | What it is |
|---|---|
| Block | A piece of the dashboard: an indicator, a chart, a table, a title, a text or a page break |
| Dashboard | A layout of blocks to view on screen. It appears in the Dashboard selector |
| Report | A layout of blocks designed for the PDF, with page orientation and page breaks |
| Report period | The dates calculated: the Dashboard's when viewing it, the delivery's when it is emailed |
| Template | A starting point with blocks already placed: "Standard dashboard", "Monthly report" and "Annual report" |
The builder is always available, but the blocks you can place depend on what your company has contracted and on your permissions: fleet blocks, for example, only appear with Fleet control. Someone who cannot see costs does not see the cost blocks, neither in the palette nor in other people's dashboards.
Prerequisites
Availability
The report builder is included: it is not subscribed to and does not need turning on. Every company has it.
If a saved dashboard has a block from a module your company no longer has (for example, a fleet block after cancelling Fleet control), that block is empty and labelled Module not contracted; the rest of the dashboard is still shown.
Permissions
Permissions are managed in Roles and Permissions. Roles are explained in Tenant administration.
| Permission | What it allows |
|---|---|
| View dashboard and reports | View shared dashboards in the Dashboard |
| Create and change custom dashboards and reports | Open the editor, create dashboards and reports and change your own |
| Export reports | Download a dashboard or report as a PDF |
| View costs | View and place the cost blocks |
| Change the configuration | Schedule deliveries and choose the company's default dashboard |
By default, the administrator, the supervisor and the roles that can change the configuration can create dashboards.
Viewing a custom dashboard
- Open the Dashboard.
- In the selector next to the title, choose the dashboard. Standard dashboard goes back to the usual one.
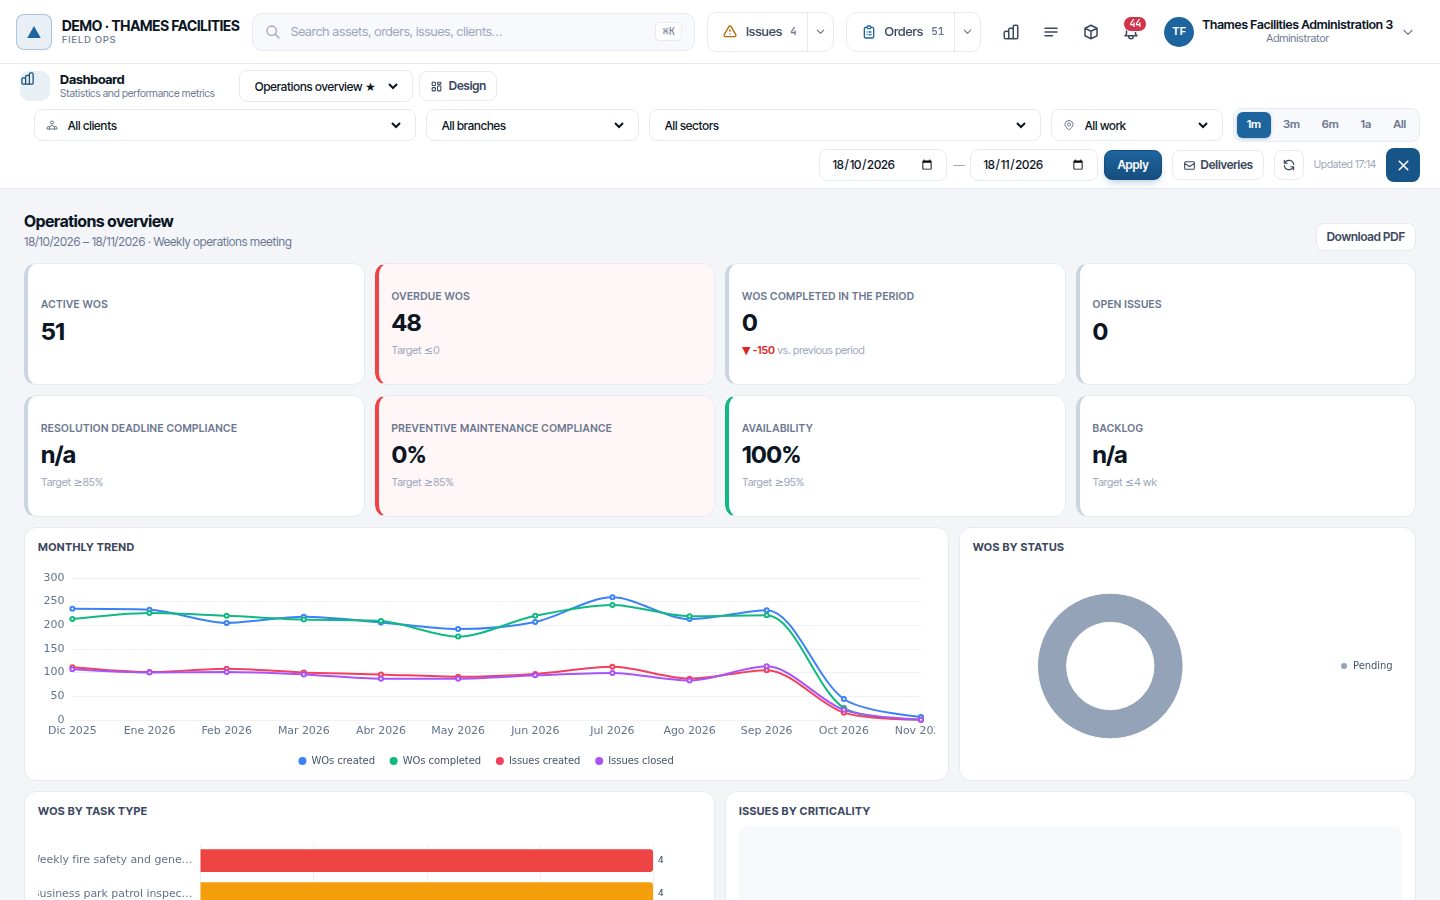
- Change the period, client, delegation or sector in the top bar. The dashboard is recalculated with those filters.
- Click Download PDF to get it on paper with the period and filters you are viewing.
The browser remembers the last dashboard you chose. If the company has a default dashboard, it opens when you enter; it is marked with a star in the selector.
On a narrow screen, the blocks are stacked one below the other.
Creating a dashboard or a report
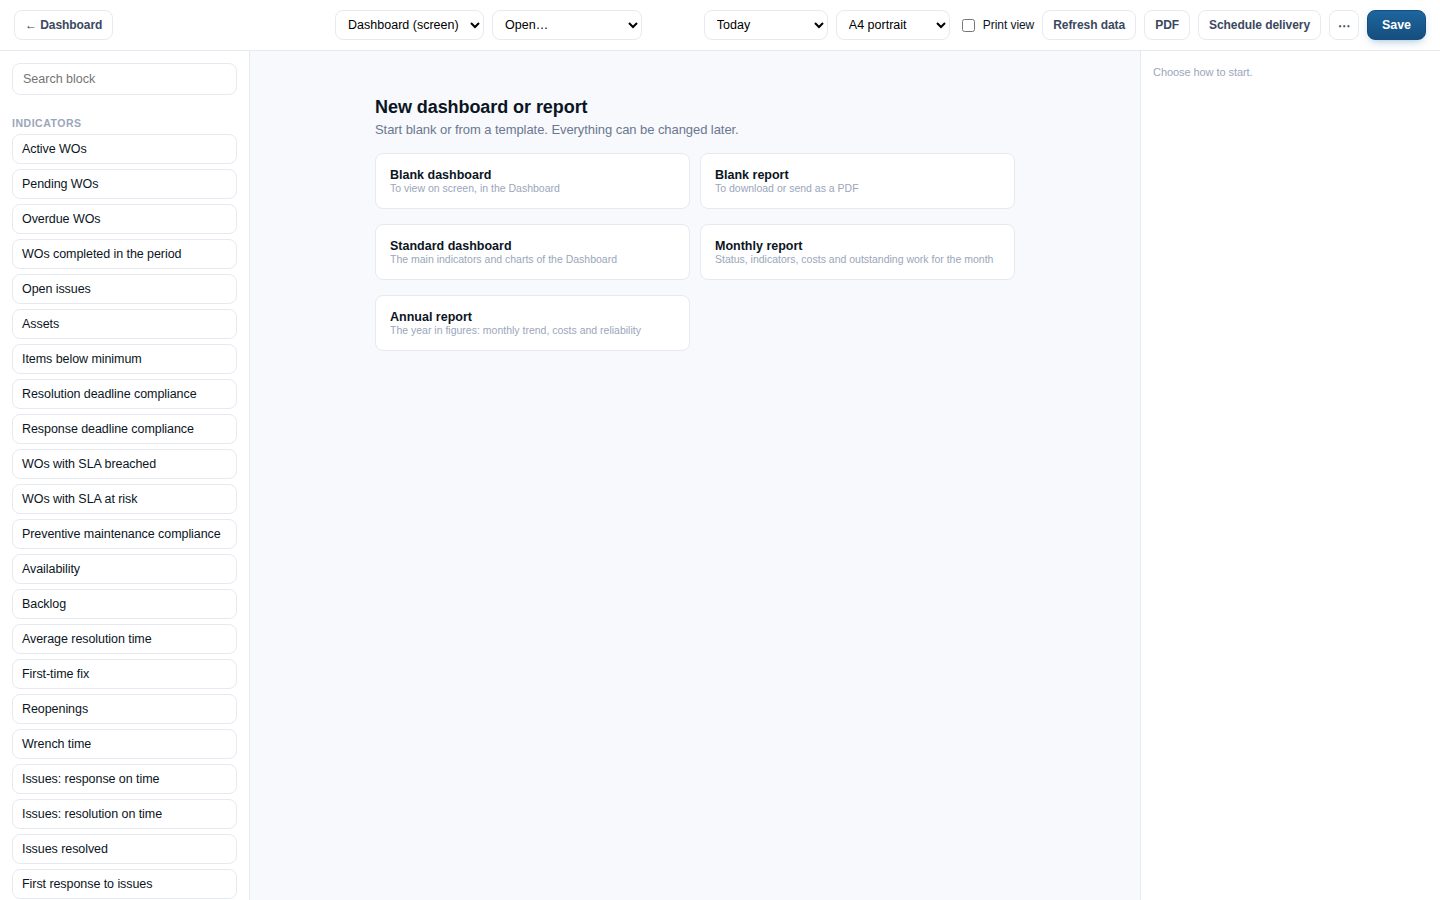
- In the Dashboard, click Design. The editor opens.
- Choose how to start: Blank dashboard, Blank report or one of the templates.
- Type the name at the top left.
- Add blocks from the palette on the left: drag them onto the canvas or click them to place them at the end.
- Move each block by dragging it and resize it from its edges.
- Click Save.
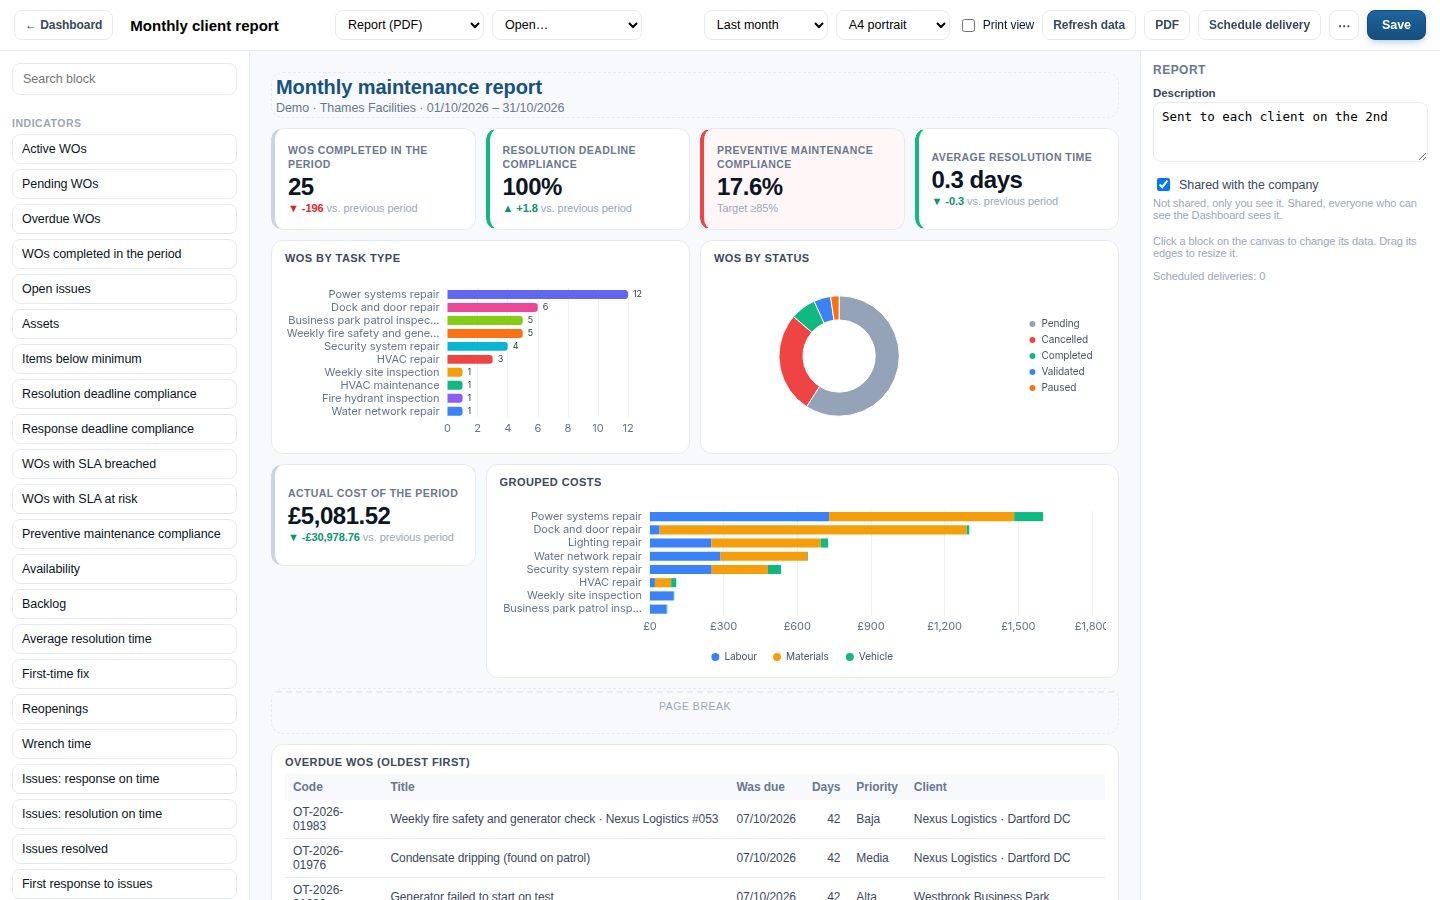
The preview uses real data for the period chosen at the top. Refresh data recalculates all the blocks.
Tip: the grid has 12 columns. Four 3-column indicators fill a row; so do an 8-column chart and a 4-column one.
Available blocks
| Group | Blocks |
|---|---|
| Indicators | Active, pending, overdue and completed WOs; open issues; assets; items below minimum; deadline and preventive compliance; availability; backlog; average resolution time; first-time fix; reopenings; wrench time |
| Work orders | By status, priority and task type; planned and unplanned; monthly trend; overdue; latest created; work by zone |
| Issues | By criticality and by status; latest issues |
| Maintenance | Mean time between failures by asset type; resolution time by criticality; assets with the most issues |
| Personnel | WOs per person; assigned and completed |
| Costs | Actual cost of the period; costs grouped by client, task type, delegation or sector; costs by month; WOs with the highest cost |
| Fleet | Trips by vehicle, person or month |
| Zones | Incursions into operating zones |
| Measurements | Sum, average, minimum, maximum or count of a measurement type, by period and grouped |
| Text and layout | Title, text and page break |
Blocks with an orange dot do heavy calculations. A report accepts at most 8 of them and 40 blocks in total.
Changing a block
Click a block on the canvas. Its properties appear on the right.
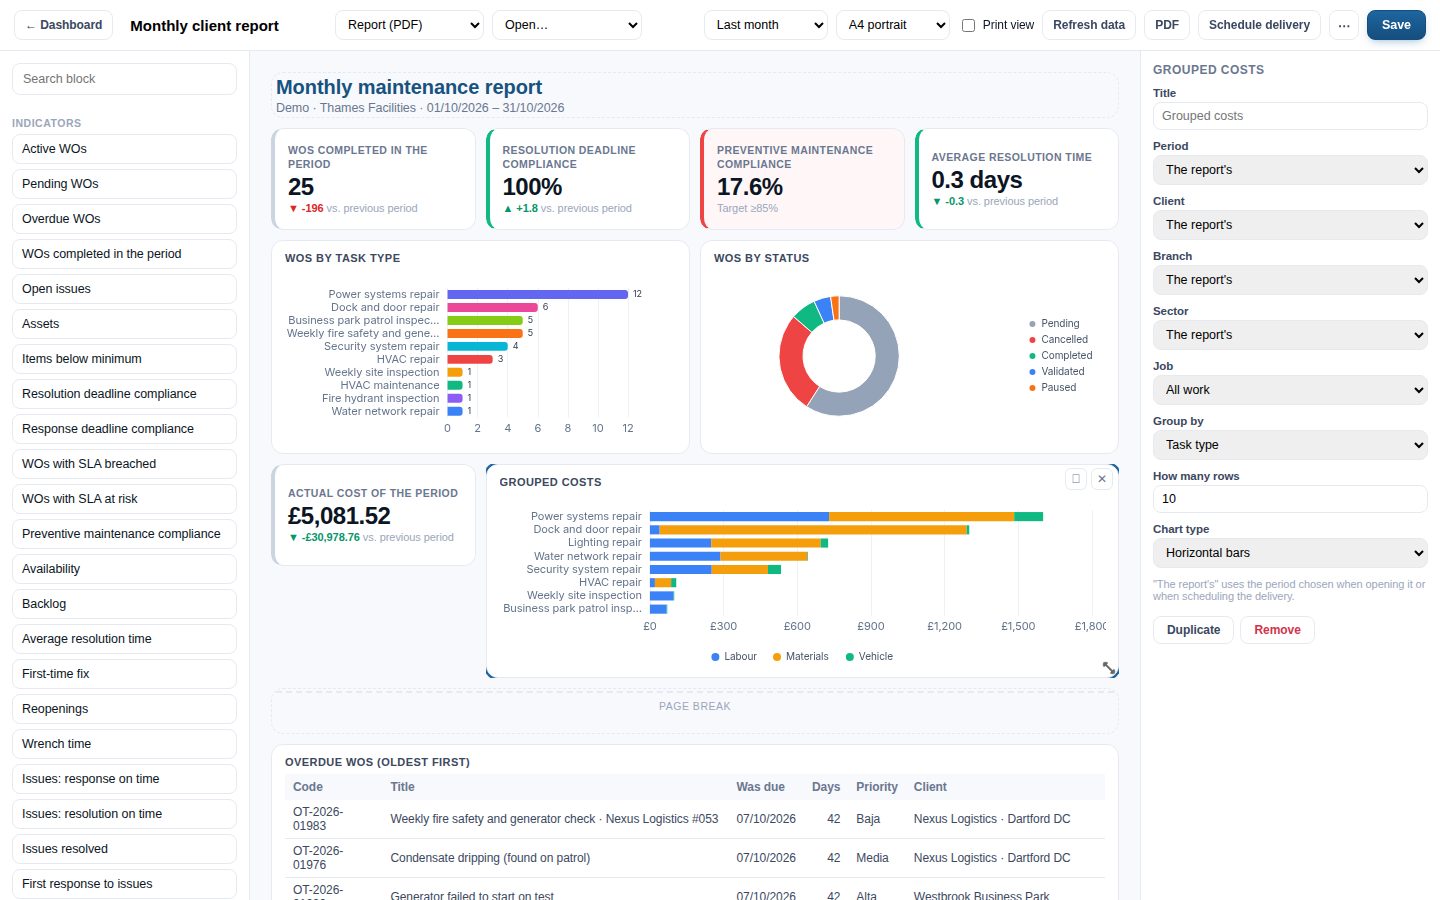
| Property | What it does |
|---|---|
| Title | Replaces the block title. Empty, its own is used |
| Period | The report's uses the period the report is opened or sent with. Another value fixes the block's own, for example the last 12 months in a monthly trend inside a last-month report |
| Client, Delegation, Sector, Work | Narrow down only that block. The report's uses the general filters |
| Chart type | Donut, vertical bars, horizontal bars, lines or table |
| How many rows | The first rows of a table or a ranking |
Titles and texts accept three placeholders filled in when calculating: {periodo} (period), {empresa} (company) and {cliente} (client).
Measurements
The Measurements block lets you choose what is calculated:
- Measurement type: litres, kilos, hours or whatever the type is.
- Calculation: sum, average, minimum, maximum or count.
- By: day, week, month, quarter, year or the whole period.
- Group by: sector, asset, client, vehicle, person, catalogue value or measuring point.
- Value: what was measured, or the consumption (the difference with the previous measurement of the same meter).
PDF reports
A report is laid out for an A4 sheet in portrait or landscape.
- Choose Report (PDF) as the type and the orientation at the top.
- Tick Print view to see the canvas with the width of the sheet.
- Add the Page break block where you want a new sheet to start.
- Click PDF to download it with the chosen period.
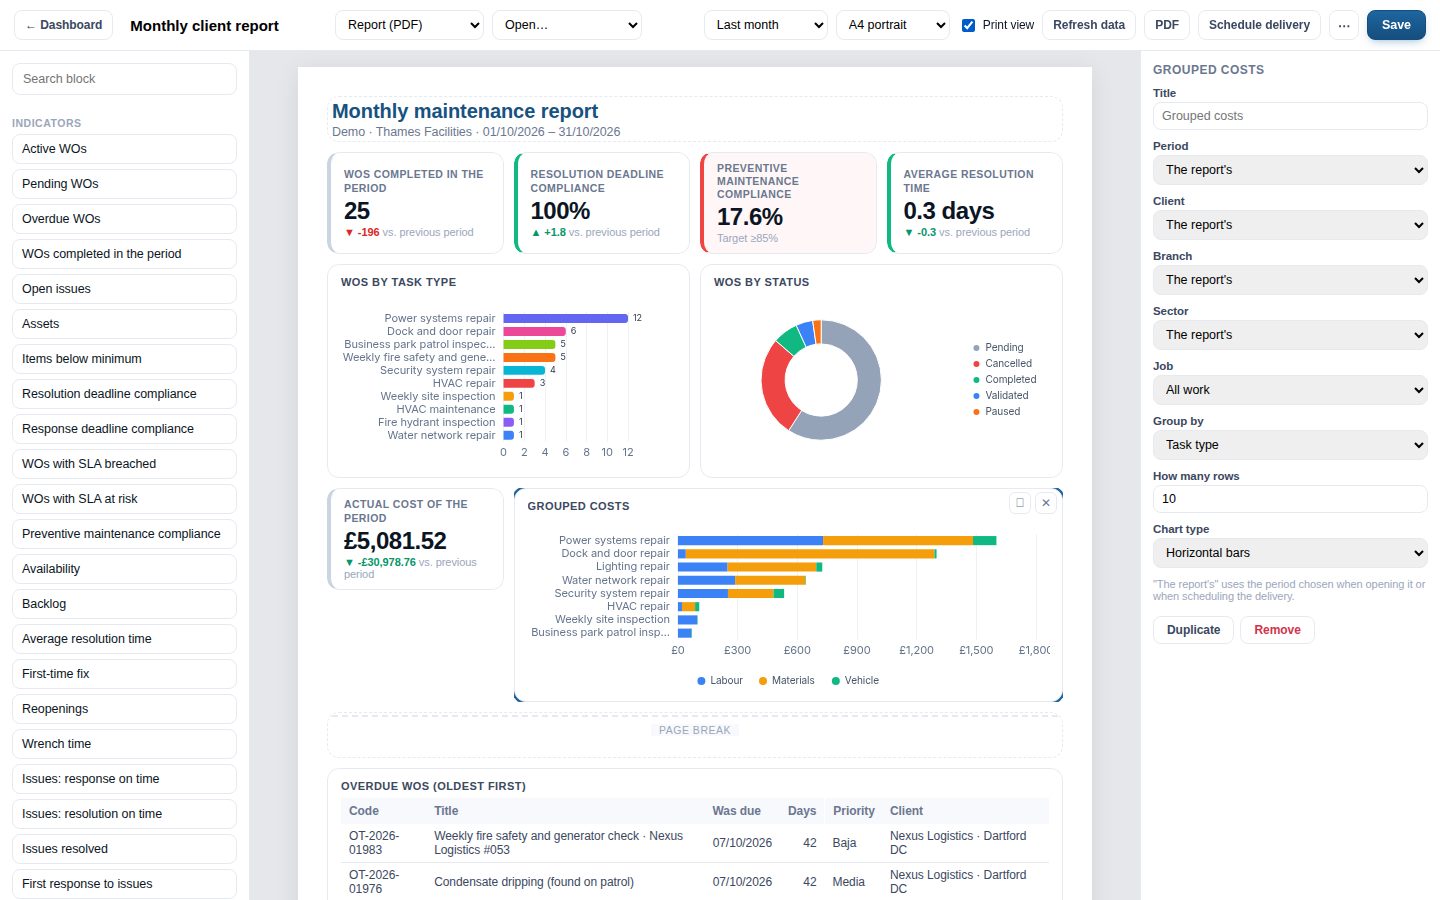
The PDF carries the header with your company logo, like the other Maptainer reports. The charts in the PDF are the same as on screen. Blocks in the same row are not split between two sheets.
Emailing a report
- In the editor, click Schedule delivery. The form opens with the report selected.
- Choose the frequency: daily, weekly, monthly or yearly (with the day and month).
- Choose which period it covers: last month, last quarter, last year, year to date, the last 12 months or another.
- Type the recipients and click Schedule.
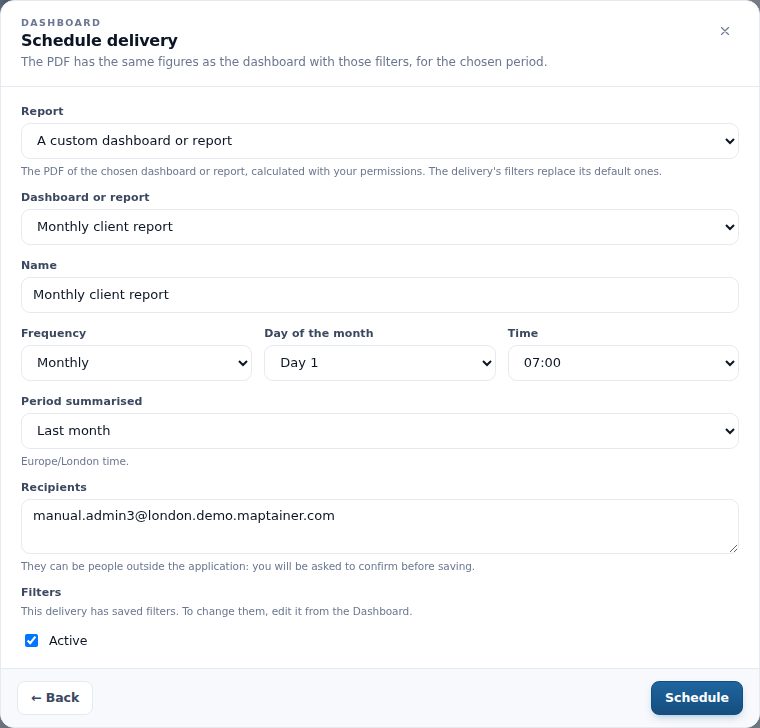
Deliveries are also managed from Deliveries in the Dashboard. There, the type A custom dashboard or report lets you choose any of those you can see. The report is calculated with the permissions of whoever last saved the delivery.
Deliveries are explained in Dashboard and lists.
Sharing and default dashboard
With no block selected, the options of the dashboard or report are on the right.
| Option | What it does |
|---|---|
| Shared with the company | Unticked, only you see it. Ticked, everyone who can see the Dashboard sees it |
| Company default dashboard | Opens when entering the Dashboard. There is only one and it must be a shared dashboard |
A shared dashboard can only be changed by whoever created it or by someone who can change the configuration. Others can save their own copy from the ⋯ button and change it.
Deleting
Click ⋯ and then Delete. A report with scheduled deliveries cannot be deleted: its deliveries must be removed first.
Limitations
- Blocks come from a closed catalogue. You cannot write your own formulas or queries.
- Free choice of measure and grouping exists for measurements and costs. For work orders and issues, the catalogue indicators and charts are used.
- A block that takes too long is shown with a warning. The rest of the dashboard keeps calculating.
- The client portal does not show custom dashboards.
See also
Last updated: